About Atrix
Lorem ipsum dolor amet consectetur adipisicing sed do eiusmod tempor incididunt labore magna aliqua enim minim veniam nostrud exercitation aboris nis aliquip exeo.
Find Us Our Location
- 629 12th St, Modesto, CA 95354 United States
- atrixmain@gmail.com
- +1 (230)-456-155-23
Blog Standard
Automated Mineral Classification and Measurement Using Machine Learning and Image Analysis
ZEN Intellesis plus ZEN Image Analysis modules offer machine learning image segmentation and classification, with image analysis and object measurements, for the light microscope. Available for use with the range of ZEISS light microscopes, from the operator-driven Axiolab 5 to the fully automated Axioscan 7 Geo, the modules offer automated identification, classification, measurement, and quantification of minerals.
Zeiss Zen Intellesis Module

Zeiss Zen Image Analysis Module
Automated Sample Analysis
Light microscopes are used daily in the evaluation of mining samples to assess the performance of the recovery process, and during exploration for new resources. Operators must perform a rigorous and accurate evaluation of samples daily, a task that can prove arduous and consume a reasonable proportion of the day. With ZEN Intellesis, and ZEN Image Analysis, the classification and measurement of the mineralogy is automatically performed, thus freeing the operator to concentrate on the interpretation of the data and their other tasks.
ZEN Intellesis in combination with ZEN Image Analysis offer advanced machine learning, trainable on site, to differentiate mineralogy for object classification and measurement; resulting in faster time to results and efficiency improvements.
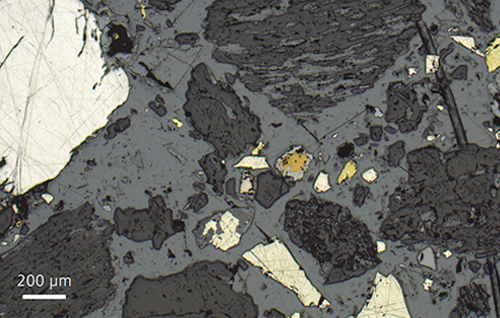
Figure 1: Reflected light image acquired with ZEISS Axiolab 5. Sample of milled copper ore mounted in a resin block and previously prepared for SEM analysis. Remnants of a carbon coating remain on some surfaces
Consistent Sample Evaluation
Quality monitoring is a continuous process reliant on feeding data into an information loop from which operational decisions are made. Evidence gathered over time forms the basis for strategic planning. Reliable, consistent data is imperative in such a situation. Unlike human operators, the ZEN Intellesis and Image Analysis modules do not tire on long days and promise consistent results sample after sample.
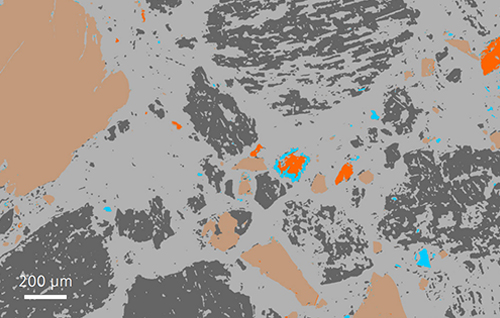
Figure 2: Artificial color map following Intellesis classification. Despite the challenges presented by sample preparation, e.g., the impossibility of obtaining a transmitted light image, surface scratches, and gauges, Intellesis automatically classifies the individual constituents of this image. Resin in light grey, gangue in dark grey, pyrite in brown, chalcopyrite in orange, and chalcocite in blue.
Flexibility in Application
Flexibility and ease of use are integral to the ZEN modules. Machine learning models can be trained locally without the need for artificial intelligence (AI) experts, and updated/ refined over time, bringing flexibility to the materials that may be classified. Furthermore, images from any ZEISS microscope can be processed, delivering levels of automation ranging from operator driven image capture with Axiolab 5, to full automation with Axioscan 7.
| Region Class Name | Count (#) | Area Percentage (%) | ID |
|---|---|---|---|
| Statistics Background | 995 | 54.13 | 1 |
| Statistics Gangue | 1314 | 30.05 | 997 |
| Statistics Pyrite | 381 | 14.6 | 2312 |
| Statistics Chalcopyrite | 274 | 0.76 | 2694 |
| Statistics Chalcocite | 443 | 0.47 | 2969 |
| Id | Region Class Name | Feret Maximum (µm) | Feret Minimum (µm) | Area (µm²) |
|---|---|---|---|---|
| A | B | C | D | G |
| 1 | Background | 43.68 | 31.24 | 804.3 |
| 2 | Background | 57.5 | 7.21 | 246.71 |
| 3 | Background | 9.32 | 5.95 | 37.06 |
| 4 | Background | 42.31 | 13.9 | 299.26 |
| 5 | Background | 14.29 | 9.12 | 59.74 |
| 6 | Background | 6.13 | 2.23 | 9.96 |
| 7 | Background | 48.18 | 11.72 | 245.05 |
| 8 | Background | 5.41 | 1.49 | 7.19 |
| 9 | Background | 32.93 | 3.08 | 55.87 |
| 10 | Background | 24.21 | 4.15 | 55.32 |
| 11 | Background | 8.32 | 1.49 | 11.06 |
| 12 | Background | 9.41 | 2.67 | 13.83 |
| 13 | Background | 35.08 | 9.67 | 243.95 |
| 14 | Background | 52.82 | 11.98 | 427.6 |
| 15 | Background | 169.41 | 20.36 | 1099.69 |
| 16 | Background | 137.77 | 8.63 | 437.55 |
| 17 | Background | 69.02 | 7.92 | 243.95 |
| 18 | Background | 1.05 | 0.74 | 0.55 |
| 18 | Background | 7.44 | 4.73 | 20.47 |
| 19 | Background | 32.29 | 10.34 | 222.37 |
| 20 | Background | 11.62 | 4.21 | 29.32 |
Figure 3. Following classification, the Image Analysis module automatically measures the individual constituents and provides statistical information, including modal distribution, size, area, perimeter, etc, as well as the modal proportion of phases present
The breadth of information that can be garnered by the fully automated Axioscan 7 Geo lends itself to more detailed analyses of the sample matter. Axioscan 7 Geo captures images using several contrast methods, and multiple angles of polarization, providing a high density of pixel information that can be interrogated and interpreted by artificial intelligence (AI) methods. For example, once Intellesis segmentation and image analysis have been implemented, the results can be further analyzed using the Petrography Analysis Toolbox (PetPAT). PetPAT accesses the wealth of data captured in Axioscan 7 Geo images to provide outputs including the angle of extinction relative to the analyzer, the position of grain boundaries, grain size distribution, grain orientation, and textural information.

Inkarp Instruments is a leading distributor and service provider of Zeiss products in India, delivering advanced scientific solutions. Committed to quality and reliability, we support researchers across the country with superior products and outstanding service.
References - Zeiss