About Atrix
Lorem ipsum dolor amet consectetur adipisicing sed do eiusmod tempor incididunt labore magna aliqua enim minim veniam nostrud exercitation aboris nis aliquip exeo.
Find Us Our Location
- 629 12th St, Modesto, CA 95354 United States
- atrixmain@gmail.com
- +1 (230)-456-155-23
Blog Standard

Electrochemical Investigations: A Modern Approach to Energy and Molecular Research
Electrochemical investigations have become a pivotal area of modern research, driven by the demand for sustainable energy solutions and deeper insights into molecular behavior. With the rapid advancement of technology and industry, global energy consumption continues to rise, creating an urgent need for high-capacity, lightweight rechargeable batteries. These innovations depend on a profound understanding of electrolyte systems and electrode surfaces, both of which are central to the improvement of energy storage systems.
Beyond energy storage, electrochemistry plays a crucial role in biochemistry and catalysis. It provides valuable information about molecules and their behaviors under specific electrochemical potentials. For instance, it sheds light on the redox-active centers in biomolecules, the reaction mechanisms of catalysts, and the formation of carbon oxides during alcohol oxidation.
The Integration of FTIR Spectroscopy with Electrochemistry
Combining Fourier-transform infrared (FTIR) spectroscopy with electrochemical methods offers a unique perspective on molecular changes and reaction processes. This integration allows researchers to correlate molecular transformations with electrochemical responses. Such insights are critical for understanding electrolyte systems and electrode surfaces, and the Bruker A530/x reflection unit is a noteworthy tool in this domain.
| Keywords | Instrumentation and Software |
| Electrode surface | INVENIO R, VERTEX |
| Electrolyte | A530/x reflection unit |
| Internal reflection | Potentiostat |
| External reflection | Rapid Scan, trigger functionality |
| Potential modulation | D31x/B MCT detector |
| FTIR spectroelectrochemistry | OPUS 3D Software |
This advanced setup supports two primary configurations for external IR reflection-absorbance spectroscopy (IRRAS):
Thin-Layer Configuration:
Enables simultaneous study of the electrolyte and electrode surfaces.Internal Reflection ATR (Attenuated Total Reflection) Configuration:
Directly analyzes the electrode surface with minimal interference from the electrolyte.
For analyzing dissolved molecules, optically transparent thin-layer electrochemical cells (OTTLE) allow for detailed transmission measurements. Using semi-transparent metal mini grid electrodes, this setup enables precise monitoring of molecular interactions near electrode surfaces.
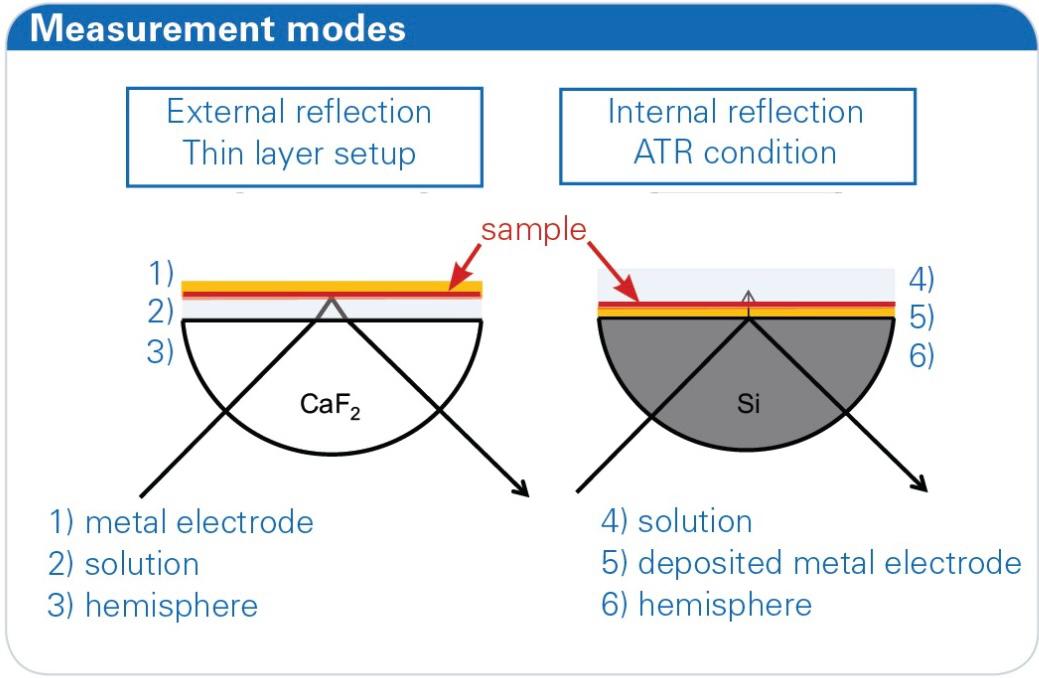
Figure 1: Different measurement modes of the A530/x reflection unit. On the left side external reflection (materials: CaF2, BaF2), on the right side internal reflection (materials: Ge, Si).
Experimental Study: Oxidation of Ferrocyanide
A classic example of electrochemical analysis involves the oxidation of ferrocyanide [Fe(CN)6]4−[Fe(CN)_6]^{4-}, which illustrates the dependence of the CN-ligand stretching vibration on the oxidation state of the iron center (FeII^\text{II} or FeIII^\text{III}). This redox system has been widely documented in literature and offers an ideal model for studying molecular transformations.
Instrumentation

Bruker VERTEX 80 FTIR Spectrometer
Experiments were conducted using a purged VERTEX80 FTIR spectrometer equipped with the A530/P accessory and a mid-band MCT detector. The setup featured a thin gold plate disk as the working electrode, alongside silver and platinum wires serving as quasi-reference and counter electrodes, respectively. Measurement parameters included a resolution of 4 cm−1^{-1}, 100 scans, and p-polarized light.
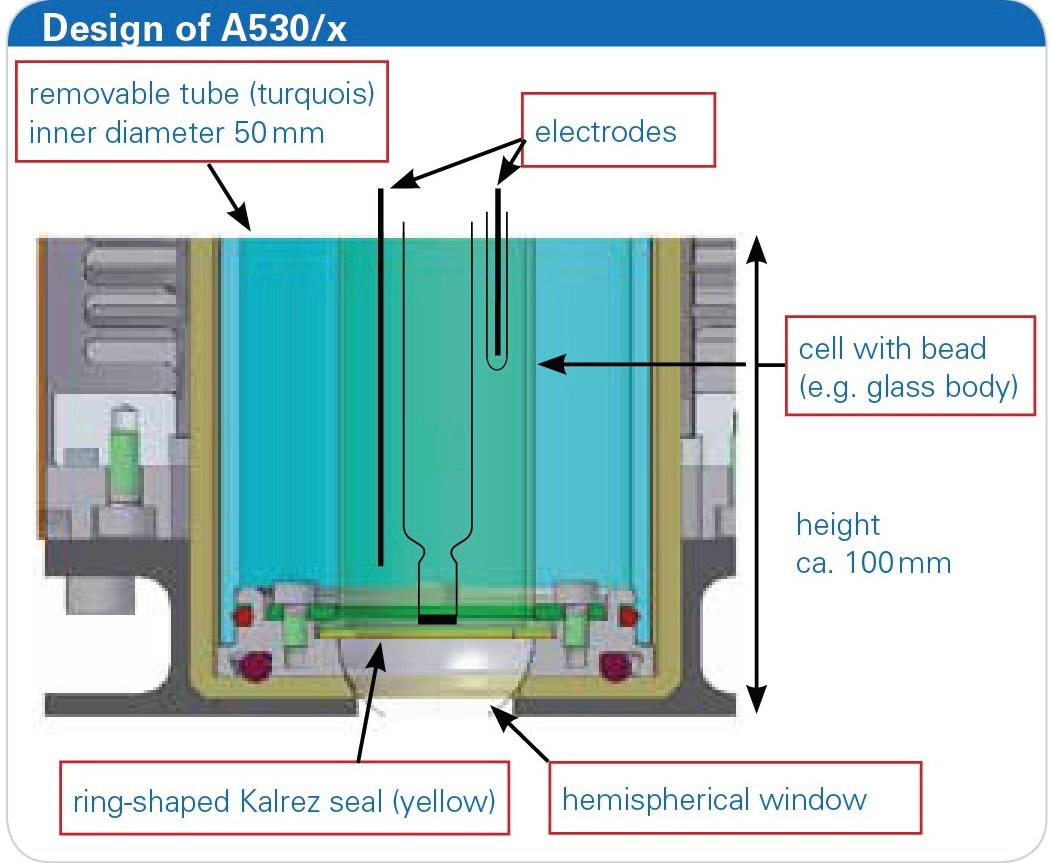
Figure 2: Design of the reflection cell A530/x with installed glass tube.
The electrochemical processes were controlled using a Gamry 600 reference potentiostat synchronized with the FTIR spectrometer. A solution of potassium ferrocyanide (20 mmol/L20 \text{ mmol/L}) and potassium chloride (1 mol/L1 \text{ mol/L}) served as the electrolyte.
![Figure 3: First and second run of a cyclic voltammogram with 0.1 V/s of ferrocyanide [Fe(CN)6] 4- in 1 M KCl solution.](assets/images/First-and-second-run-of-cyclic-voltammogram.jpeg)
Figure 3: First and second run of a cyclic voltammogram with 0.1 V/s of ferrocyanide [Fe(CN)6] 4- in 1 M KCl solution.
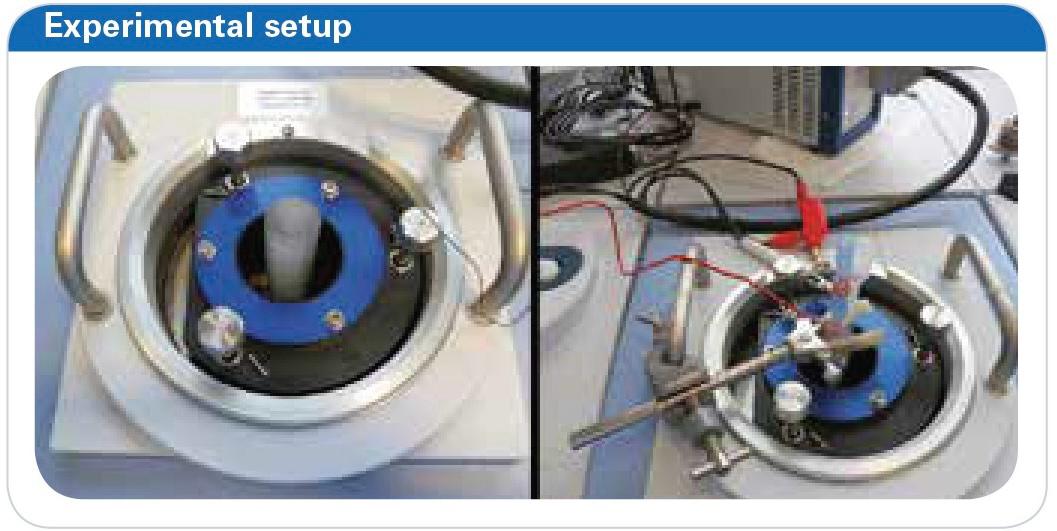
Figure 4: Pictures of the experimental setup. Reflection unit with polymeric flask installed (left), complete cell installed and connected (right).
Results and Observations
A cyclic voltammogram was initially recorded to establish the oxidation and reduction potentials of the ferrocyanide/ferricyanide system. Subsequent FTIR spectroelectrochemical studies were performed in ATR mode using a silicon hemispherical window. The solution was monitored at varying potentials, and the resulting IR spectra were analyzed.
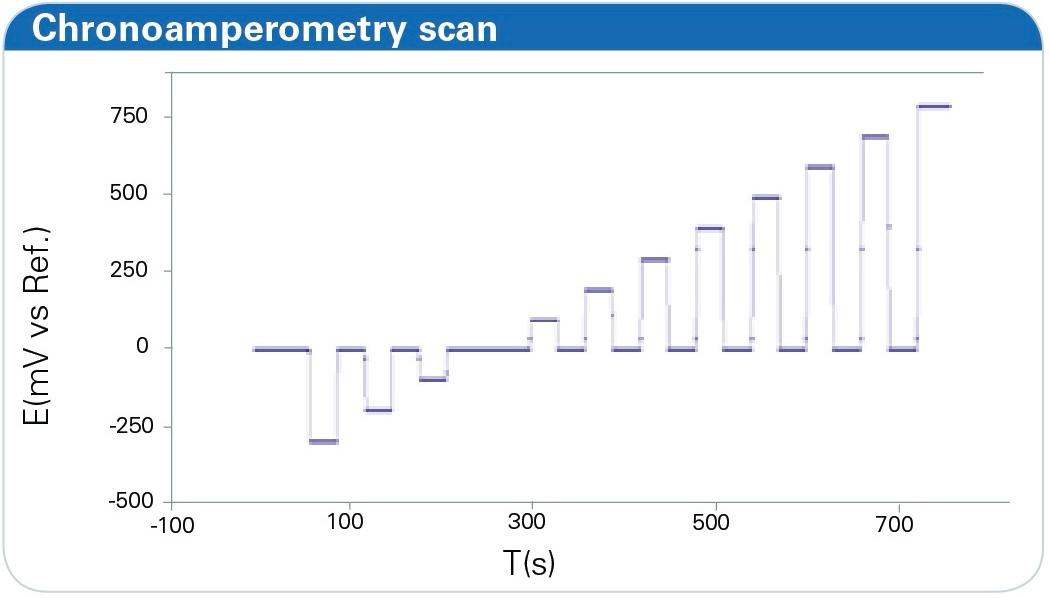
Figure 5: Potential change during an experimental run. Depicted like given in chronoamperometry. IR spectra are measured at the defined potential levels.
A key observation was the shift in the CN-ligand stretching vibration corresponding to the redox state. Specifically:
Reduced Form ([Fe(CN)6]4−[Fe(CN)_6]^{4-}):
IR absorption band at 2039 cm−1^{-1}.Oxidized Form ([Fe(CN)6]3−[Fe(CN)_6]^{3-}):
IR absorption band at 2115 cm−1^{-1}.
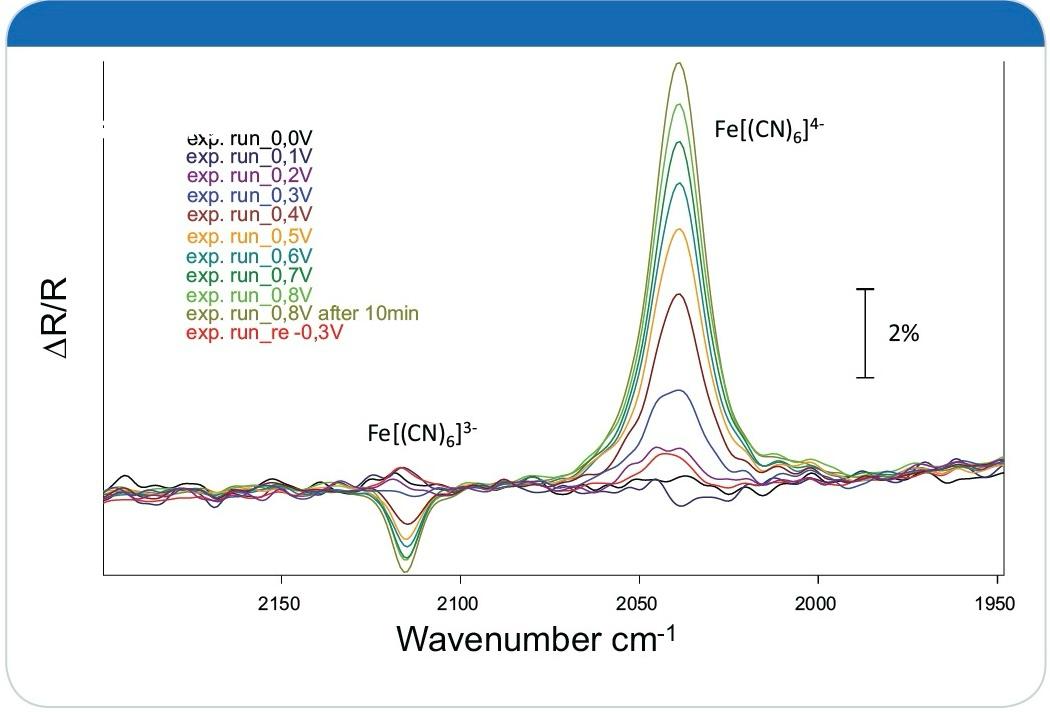
Figure 6: IR spectra of the ferrocyanide solution measured at potentials ranging from -0.3 V to 0.8V shown as SNIFTIRS type spectra.
These shifts were further illustrated using SNIFTIRS (Subtractively Normalized Interfacial Fourier Transform IR Spectroscopy) spectra and 3D time-resolved plots, providing a clear depiction of the redox process.
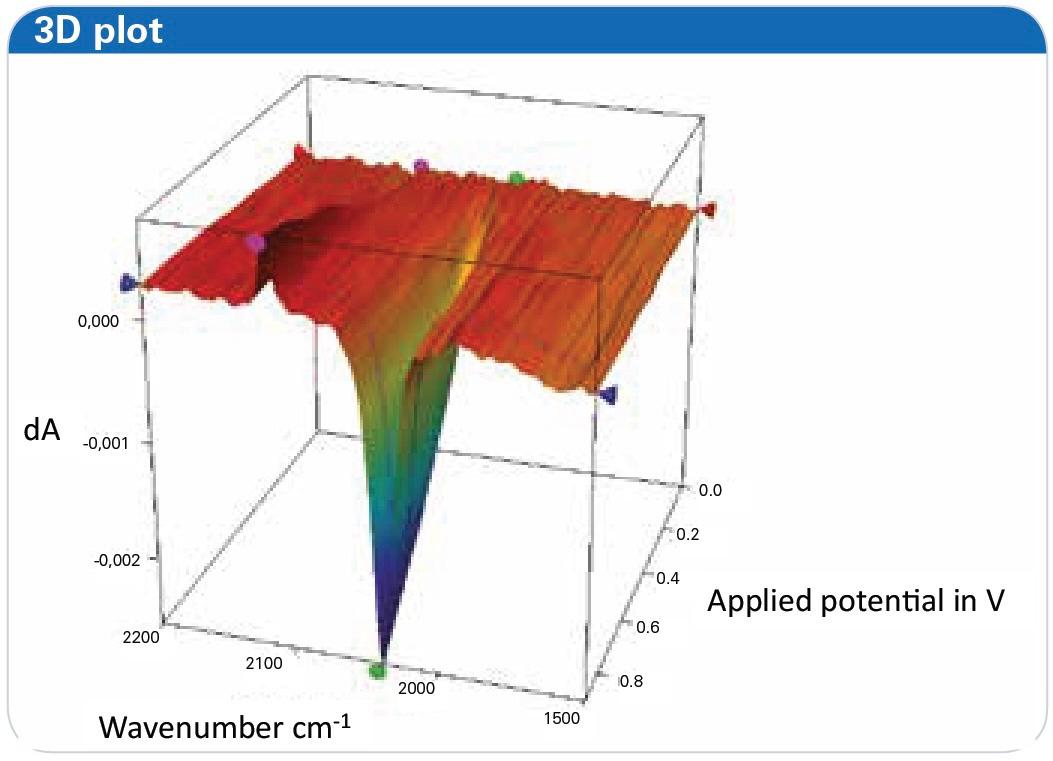
Figure 7: Three dimensional representation of the oxidation of a ferrocyanide solution at potentials ranging from -0.3 V to 0.8 V, shown as 3D-plot as offered in the OPUS software.
Layer Thickness Analysis
For thin-layer studies, the thickness of the electrolyte layer between the electrode surface and the hemispherical window was determined using interference patterns. In this setup, the layer thickness was calculated as approximately 27μm27 \mu\text{m}, ensuring precise measurements of molecular interactions within the electrochemical cell.
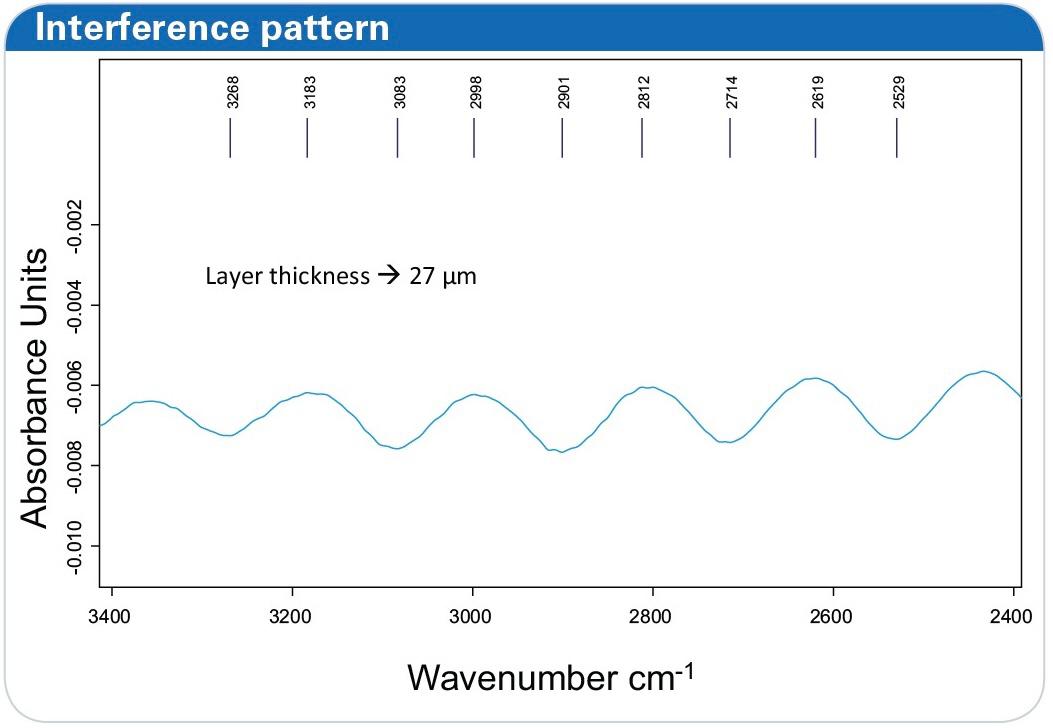
Figure 8: IR spectra of the empty electrochemical cell measured in the external reflection mode using a barium fluoride hemispherical window. The layer thickness in this measurement between electrode surface and window is determined to 27 μm.
Conclusion
The study of ferrocyanide oxidation through FTIR spectroelectrochemistry exemplifies the power of this combined analytical technique. By monitoring molecular changes in real-time and correlating them with electrochemical potentials, researchers can gain invaluable insights into reaction mechanisms.
The use of BEING’s BPK-9870A Automatic Kjeldahl Nitrogen Analyzer demonstrated efficient, accurate, and reproducible results in protein analysis for soybeans, reinforcing the method’s reliability and relevance in modern scientific research and industry applications.
One of the main advantages of this setup is its automation and synchronization. The integration of the potentiostat and spectrometer enables seamless control of experimental parameters, ensuring accurate and reliable data collection. This approach simplifies the monitoring of electrochemical processes, making it a valuable tool for energy research, biochemistry, and catalysis.
FTIR spectroelectrochemistry stands as a cornerstone of modern scientific investigation, bridging the gap between molecular-level insights and practical applications in energy and beyond.
Inkarp Instruments, the authorized distributor of Bruker products in India, is renowned as the best distributor and service provider in India for Bruker's Vertex 80 FTIR Spectrometer. Committed to delivering advanced scientific solutions, Inkarp ensures exceptional product quality and reliable support for researchers nationwide.
References
[1] C. Berthomieu , L. Marboutin, F. Dupeyrat, P. Bouyer, Biopolymers 2006, 82 (4), 363-367.
[2] Bruker Product Note M140 - 08/12: A530/P or A530/V Reflection Unit prepared for Electrochemical Cell.
[3] Bruker Application Note AN40 (D. A. Moss, W. Mäntele): FTIR Spectroelectrochemistry of Proteins;
[4] S. R. Domingos, H. Luyten ,F. van Anrooij, H. J. Sanders, B. H. Bakker, W. J. Buma, F. Hartl, S. Woutersen, Rev. Sci. Instrum. 2013, 84, 033103.
[5] S. M. Rosendahl, F. Borondics, T. E. May, T. M. Pedersen and I. J. Burgess Anal. Chem. 2011, 83 (10), 3632–3639.
[6] A. Kabbabi, R. Faure, R. Durand, B. Beden, F. Hahn, J.-M. Leger, C. Lamy, J. Electroanal.Chem. 1998, 444, 1–53.